

Automated reporting for SaaS: a quick guide


With the explosion in the volume of business data available to SaaS companies, reporting on Excel or Google Sheets is reaching its limits.
Automated reporting is becoming essential for companies—especially SaaS companies—to make the right decisions, by accessing the right data at the right time.
We explain why and how to automate SaaS reports.
1 - Disadvantages of manual reporting
Running a SaaS startup in an increasingly uncertain landscape also means keeping a close eye on its management. Managers and investors alike need relevant, periodic dashboards to quickly visualize the business’s various KPIs.
1.1 - How do I create a classic report in Excel or Google Sheets?
The traditional method for producing this periodic report is often to find a ready-to-use template. But this solution quickly shows its limitations. The person in charge of KPIs and dashboards has to do everything by hand: adapting the template, formulas, data entry and updating, auditing and verification, graphs, as well as presenting and sharing the report.
This means collecting information every month,reprocessing it, calculating indicators, modifying graphs and so on. This method wastes a lot of time and energy. What’s more, using a spreadsheet correctly for elaborate formulas or graphs is not for everyone. What’s more,automating reporting via VBA or scripting also requires a certain level of knowledge and allows very little flexibility.
1.2 - Reporting without automation: complex data collection
The first task for spreadsheet-based reporting is to collect the source data. Relevant dashboards generally combine various data sources, such as invoicing,accounting, treasury, CRM, HRIS, etc. This recovery is carried out via periodic file exports, which is very time-consuming.
As a company grows, the sources of information multiply and become more complex. Without automated reporting, the people in charge of producing the reports run the risk of getting lost in the flood of data. This may reduce the reliability of the information processed (and waste a lot of time).
1.3 - Calculating KPIs by hand: the disadvantages
In a SaaS environment, the KPIs essential for day-to-day management are numerous and sometimes complex to calculate. It’s hard to imagine calculating certain key indicators by hand each month, such as ARPA (average revenue per customer), cash runway, or LTV/CAC ratio, for example. As for changes in customer behavior, which can be studied through cohort analysis, forget it! Without automation,this task is impossible.
1.4 - Excel or Google Sheets as reporting tools: sources of errors
Spreadsheet reporting is time-consuming. While the person in charge of dashboards performs this type of task by hand, they can’t invest their energy in data analytics.This in turn means that periodic KPIs are not always available on time,compared with an automated solution that provides a real-time view of the business.
Choosing non-automated reporting also carries with it a risk of errors compared with software that automatically collects, processes,and formats data.
To minimize this risk, manual reporting requires multiple checks at various points in the files, as well as thorough re-reading of figures and formula. Without an experienced controller, this process can be time-consuming, and has to be carried out each time the figures are updated. The ultimate risk is that a manager will make important decisions on the basis of a report containing erroneous data.
{{discover}}
2 - Automated reporting and its key benefits
Fortunately, SaaS companies like all SMEs can now find tools that automate reporting and KPI calculation. Here’s how these management tools work, and how they can help you steer your company’s performance.
2.1 - Automated reporting: a new standard for companies
The production of KPIs and dashboards through the automation of reporting is becoming the norm today. The use of such a tool (often available as SaaS) brings real time and quality savings for users. These new automated reporting tools can largely replace Excel or Google Sheets.
The best reporting tools automate the entire reporting process:
- collection;
- storage;
- processing;
- and conversion of the data into KPIs and graphs.
Users can then concentrate on the essentials: data analytics and decision-making.
Some business intelligence tools (Tableau, Power BI,Google Data Studio, etc.) require a huge investment of time and energy before they can be used to their full potential. They require specific settings to meet the needs of the company or business. They also require team training to maintain reporting is of good quality and suited to the company’s needs as they evolve.
Other tools offer more accessible, turnkey solutions for VSEs, SMEs, and startups. Read about Fincome’s automated reporting solution for your SaaS business.
2.2 - Fincome, an automated reporting solution for SaaS applications

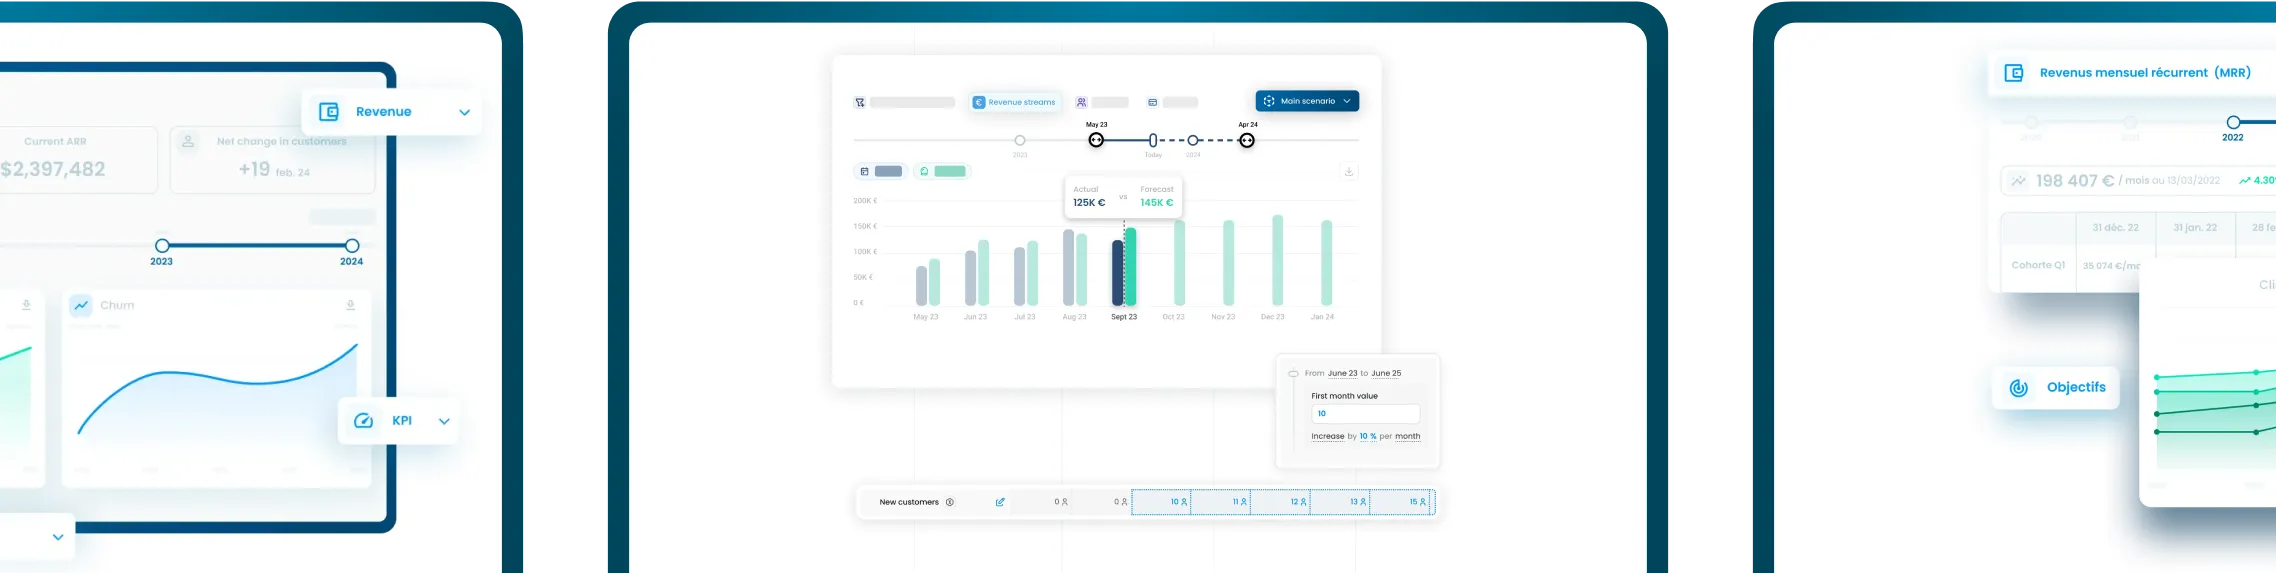
Our aim at Fincome is to provide SaaS managers with analytical management tools to help them manage their business. As such, we offer automated reporting integrated with our platform.
a - Our special SaaS solution

Fincome’s advantage lies in its mastery of SaaS-specific KPIs. We are fully aware of the financial management needs of these companies and have built a turnkey management solution for them. Our platform gives access to a full, real-time view of our subscribers’ performance that directly links to their various data sources.
b - Automate your reports to focus on analysis
By opting for an automated, online reporting solution,SaaS managers (and/or their partners: CFOs and chartered accountants) can free themselves from the time-consuming—and even error-prone—task of manually compiling reports. Instead, they can concentrate on analyzing key indicators, which are essential for decision-making.
Automated financial reporting represents a real technological advance for companies, including VSEs, SMEs, and startups. Today,automated reporting is easy thanks to turnkey, tailor-made tools.
To see what Fincome can do for your automated reporting, book a free online demo.
💡 Complete your reading with the following articles:
- 3 common mistakes that kill SaaS startups
- Top tips for communicating with SaaS investors
- KPI reporting at every stage of your startup
- Why is SaaS financial reporting still crucial for your startup in 2023?
{{newsletter}}


Join our
Receive exclusive SaaS leader interviews and webinars every month, along with our in-depth analyses of the latest SaaS trends, with Fincome Pulse.


Discover Fincome!
Frequently Asked Questions
Expense Tracking:
Fincome is a SaaS revenue management platform designed specifically for companies with recurring revenue models (any business selling subscriptions).
Fincome automates the tracking and management of your revenues and associated KPIs (churn, LTV, CAC, etc.) in real time, without the need for a data team or manual processing, thanks to direct integrations with your billing systems and ERP.
Unlike generic BI tools, Fincome offers a turnkey, intuitive solution tailored to the specific needs of subscription-based businesses, enabling seamless collaboration across your finance, GTM, and CSM teams.
Fincome is built exclusively for companies with recurring revenue models, meaning those that track MRR or ARR, such as:
• Software publishers (SaaS)
• Media companies
• Mobile apps
• Any other B2B or B2C subscription business looking to professionalize revenue management
Fincome supports organizations at every stage of growth, from startups to mid-market and large international enterprises.
With Fincome, you gain access to a full suite of modules:
✅ Revenue: detailed ARR/MRR breakdown, cohort analysis, detection of billing errors or omissions, revenue recognition and deferred revenue (PCA)
✅ Growth: analysis of ARR movements (new business, expansion, churn, reactivation), identification of growth drivers
✅ Unit Economics: LTV, CAC, and LTV/CAC analysis by segment, channel, or geography to optimize margins
✅ Retention: deep cohort analyses, identification of key retention drivers
✅ Renewals: future MRR projections, opportunity forecasting, and churn risk reduction
✅ Forecasting: revenue growth scenario modeling to better inform strategic decisions
Fincome is the only turnkey platform built specifically for recurring revenue businesses that combines:
✅ A complete, reliable view of your recurring revenues (MRR, ARR, churn, LTV, CAC, cohorts, renewals, revenue recognition, deferred revenue)
✅ Fully customizable, automated, shareable reports powered by AI, delivering actionable insights to guide your strategic decisions
✅ Expert support to help structure and interpret your analyses, without needing to build an internal data team
✅ The ability to generate future growth scenarios, compare them side by side, and track actual vs. forecasted performance, all in real time
Unlike traditional BI tools, which require you to build and maintain your own metrics (often consuming internal resources just to produce static data visualizations), Fincome transforms your SaaS metrics into concrete, actionable recommendations — helping you move faster, with more impact and operational efficiency.
Yes! If you use an unlisted or in-house billing system, no problem — you can easily import your billing data via Excel or push it through our public API. You can access our public API documentation here.
With Fincome, you can:
✅ Reduce up to 90% of the time spent calculating and reporting your KPIs
✅ Make faster, more accurate strategic decisions
✅ Recover up to 5% of lost revenue by detecting errors or omissions
✅ Cut the risk of manual spreadsheet errors by 80%
Absolutely. Data security is at the heart of what we do. Fincome is SOC 2 Type I certified, ensuring a high level of data security and protection.
Your data is collected exclusively via read-only APIs and hosted on secure servers located in France. We never share your data with third parties without your consent.
For a detailed review of our security practices, please visit our dedicated security page.
At Fincome, customer success is a core priority. We guide you from the very start — structuring your data, training your teams, and optimizing your use of the platform to deliver value quickly.
Our team remains by your side to answer strategic or technical questions, share best practices, and help you get the most out of your analyses.
Simply request a demo on our website. We’ll walk you through the platform, assess your needs, and guide you through a smooth deployment.
Most deployments and team trainings take no more than two weeks to get fully up and running.
👉 Request a demo
Income Analytics:
Lorem ipsum dolor sit amet consectetur adipiscing elit etiam vehicula. Etiam vehicula condimentum nunc, a semper elit luctus id. Duis fringilla enim non neque aliquet.
Lorem ipsum dolor sit amet consectetur adipiscing elit etiam vehicula. Etiam vehicula condimentum nunc, a semper elit luctus id. Duis fringilla enim non neque aliquet.
Lorem ipsum dolor sit amet consectetur adipiscing elit etiam vehicula. Etiam vehicula condimentum nunc, a semper elit luctus id. Duis fringilla enim non neque aliquet.
Budget Management:
Lorem ipsum dolor sit amet consectetur adipiscing elit etiam vehicula. Etiam vehicula condimentum nunc, a semper elit luctus id. Duis fringilla enim non neque aliquet.
Lorem ipsum dolor sit amet consectetur adipiscing elit etiam vehicula. Etiam vehicula condimentum nunc, a semper elit luctus id. Duis fringilla enim non neque aliquet.
Lorem ipsum dolor sit amet consectetur adipiscing elit etiam vehicula. Etiam vehicula condimentum nunc, a semper elit luctus id. Duis fringilla enim non neque aliquet.
Wealth Management:
Lorem ipsum dolor sit amet consectetur adipiscing elit etiam vehicula. Etiam vehicula condimentum nunc, a semper elit luctus id. Duis fringilla enim non neque aliquet.
Lorem ipsum dolor sit amet consectetur adipiscing elit etiam vehicula. Etiam vehicula condimentum nunc, a semper elit luctus id. Duis fringilla enim non neque aliquet.
Lorem ipsum dolor sit amet consectetur adipiscing elit etiam vehicula. Etiam vehicula condimentum nunc, a semper elit luctus id. Duis fringilla enim non neque aliquet.