

Contribution Margin and CAC Payback: The twin engines of SaaS profitability

Introduction
In B2B SaaS, growth without efficiency destroys value. Investors and boards now scrutinize how revenue is earned—unit economics, payback, and the path to profitability—not just the top line. Two metrics make this analysis rigorous: Contribution Margin (CM) and CAC Payback Period. CM measures the cash each customer generates after variable costs; CAC Payback shows how quickly that cash repays acquisition spend. Together they reveal whether growth compounds or consumes capital. This guide precisely defines both metrics, contrasts them with gross margin, shares relevant benchmarks, and delivers detailed, executive-level playbooks to optimize each lever. It aims to equip SaaS leaders with a decision-making framework that meets investor standards, enabling profitable, capital-efficient scaling.
What is Contribution Margin in SaaS?
Definition and Formula
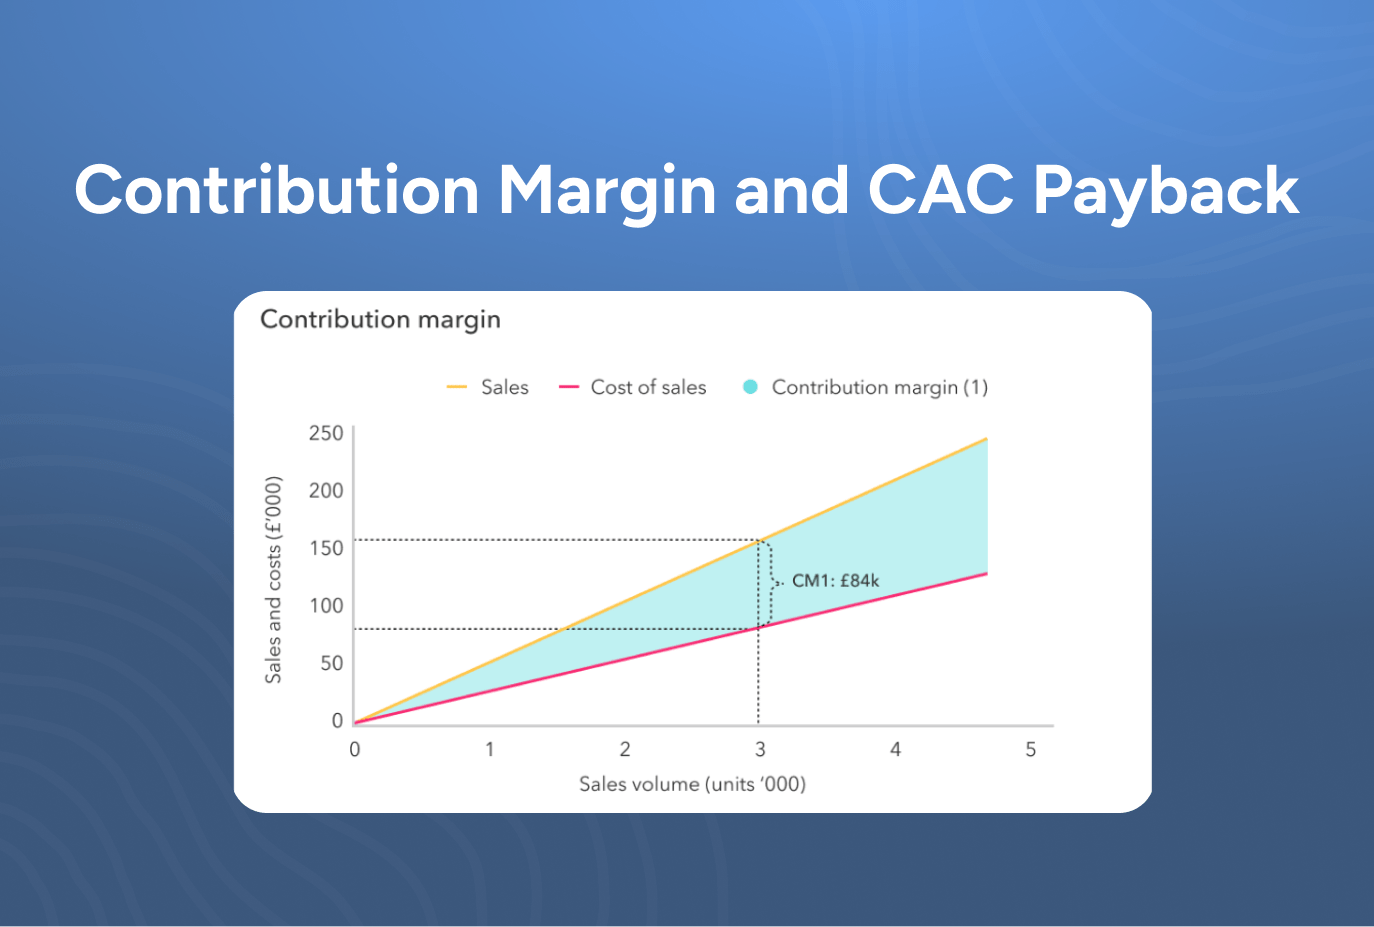
Contribution Margin (CM) measures the proportion of revenue that remains after deducting variable costs directly tied to serving a customer. It reflects the true profit contribution of each account before fixed costs are applied.

Source : https://www.flinder.co/insights/what-is-contribution-margin
Formula:
CM % = (Revenue − Variable Costs) / Revenue
At an account level:
Contribution per account (€/month) = ARPA × CM %
Variable costs include expenses that scale with customer volume: cloud hosting, third-party transaction fees, ticket-driven customer support, onboarding or implementation hours tied to seat count, and usage-linked vendor fees. Fixed costs—such as R&D, core product development, most G&A, and the majority of sales & marketing—are excluded because they remain constant regardless of customer count.
CM is a critical litmus test for scalable profitability. A high CM means each new account generates significant free cash to cover fixed costs, reinvest in growth, and strengthen cash reserves. A low CM signals structural inefficiencies—pricing misalignment, costly delivery models, or inefficient infrastructure—that limit growth potential.
Example and Impact
ARPA = €500/month; variable costs = €100/month (hosting, support):
CM % = (€500 − €100) / €500 = 80% → Contribution per account = €400/month
In this example, each account contributes €400/month toward fixed costs and profit. If fixed costs total €200,000/month, the business needs 500 accounts to break even. Raising CM to 85% boosts contribution to €425/account, lowering the breakeven point to 471 accounts. Even modest CM improvements—through automation, vendor renegotiation, or pricing changes—can drastically shorten time to profitability, reduce CAC payback, and extend runway.
CM vs. Gross Margin (and Why Both Matter)
Gross Margin is an accounting measure subtracting all COGS (both fixed and variable) from revenue—ideal for high-level profitability analysis, investor reporting, and industry benchmarking.
Contribution Margin is an operational measure that subtracts only costs that scale directly with each additional customer, isolating per-customer profitability. This makes CM the correct denominator for CAC payback at account or segment level.
A SaaS company can report a healthy gross margin yet suffer from a weak CM if variable costs per customer are too high. Conversely, a strong CM ensures scaling translates efficiently into incremental cash flow.
Why CM is Central to Unit Economics - and How to Improve It
A strong CM not only increases cash available to cover fixed costs but also improves the speed, sustainability, and capital efficiency of growth:
- Pricing & packaging: Engineer tiers so that post-support contribution comfortably exceeds acquisition cost. Mispricing silently erodes CM.
- Segmentation: Target ICPs, industries, or regions with structurally higher CM to maximize capital efficiency.
- Service model: Minimize high-touch processes. Automate onboarding/support or reserve them for premium tiers.
Frequent pitfalls:
- Misclassifying fixed support as variable → Separate ticket-driven workload from baseline staffing; measure incremental effort.
- Ignoring rebates/credits → Net them against variable costs.
- Underpricing high-touch tiers → Add onboarding fees, set usage limits, align value metrics to cost to serve.
High-impact levers:
- Automate onboarding/support (guided setup, in-app help, AI deflection).
- Optimize infrastructure (cloud cost controls, reserved capacity, vendor renegotiation).
- Adjust pricing/packaging (usage-based add-ons, minimum commitments, paid premium support).
- Focus on high-margin segments (ICP discipline; exit low-margin markets).
Healthy B2B SaaS companies typically operate at 70–80% CM. Below 70% suggests structural inefficiencies; above 80% creates a compounding advantage—accelerating CAC payback and freeing capital for reinvestment.
{{discover}}
What is CAC Payback Period?
Definition, Benchmarks, and Strategic Value
CAC Payback Period measures the time it takes for an average customer’s monthly contribution to fully cover the cost of acquiring them. It is a direct indicator of capital efficiency, showing how quickly acquisition investments turn into recoverable cash.
Formula:
CAC Payback (months) = CAC / (ARPA × CM %), or,
Simplified CAC Payback (months) = CAC / ARPA
At a company-wide level, variants may use gross margin-adjusted new ARR and total sales & marketing spend for a given period. However, for decision-making at the ICP, segment, or channel level, the account-based formula above provides the most actionable insight.
Benchmarks:
- Healthy B2B SaaS: < 12 months
- Best-in-class PLG or efficient sales-led models: 6–9 months
- >18 months: Often signals pricing, sales efficiency, or product-market fit issues.
A shorter payback period delivers three strategic advantages:
- Cash efficiency – Growth can be funded largely from operating cash flows, reducing reliance on external financing.
- Extended runway – Payback under a year decreases dependence on future funding rounds.
- Better capital allocation – Enables data-driven prioritization of channels, segments, and pricing motions with the fastest returns.
Example and Impact
CAC = €1,200; ARPA = €200; CM % = 80% → monthly contribution = €160 → Payback = 7.5 months.
In this scenario, acquisition cost recovery happens in just over seven months. Reducing payback from 12 to 8 months can free millions in annual cash flow, extend runway, and allow for faster scaling without dilution.
Frequent Pitfalls and High-Impact Levers
Pitfalls to avoid:
- Underestimating CAC → Include all acquisition-related costs: salaries, commissions, software, contractors, events, partner fees.
- Ignoring ramp and discounts → First-year ARPA should reflect realistic onboarding and promotions.
- Aggregating dissimilar cohorts → Calculate separately by ICP, plan, region, and channel.
Levers to shorten payback:
- Increase ARPA: Value-based pricing, premium add-ons, annual prepayment incentives.
- Improve conversion rates: Sharpen ICP targeting, streamline onboarding, clarify pricing.
- Shorten sales cycle: PLG entry points, transparent pricing, ROI-driven sales tools.
- Lower CAC: Focus on high-ROI channels, expand content/SEO, boost referrals, optimize SDR processes.
How CM and CAC Payback Work Together
The Operating Flywheel
Contribution Margin (CM) and CAC Payback are not isolated metrics—they are interdependent levers in a SaaS company’s growth engine. Higher CM means each customer generates more monthly contribution, which directly reduces the time required to recover acquisition costs. This faster recovery—or shorter payback—unlocks the ability to reinvest into customer acquisition while maintaining cash efficiency. The result is a virtuous cycle: more cash per account → shorter payback → faster reinvestment → accelerated growth without draining runway.
In practical terms, a 5‑point increase in CM can cut payback by weeks or months. For companies balancing aggressive growth targets with capital constraints, this change can be the difference between self‑funded scaling and a dilutive fundraising round.
LTV/CAC and Profitability Dynamics
While CAC Payback measures speed of cost recovery, the LTV/CAC ratio measures the overall profitability of a customer over their lifetime.
LTV = ARPA × CM % × Customer Lifetime (months)
LTV/CAC = (ARPA × CM % × Lifetime) / CAC
- Raising CM % or ARPA improves both CAC Payback and LTV/CAC simultaneously—these are the most powerful cross‑lever improvements in SaaS economics.
- Extending lifetime—through stronger retention, improved Net Revenue Retention (NRR), or expansion revenue—improves LTV/CAC but does not affect the initial payback period. Leaders should treat these as complementary but distinct levers.
Why This Matters for Executives and Investors
For executives, understanding how CM and CAC Payback interplay provides a clear line of sight between operational efficiency and valuation multiples. For investors, it signals whether the company’s growth is self‑sustaining or capital‑consuming. When both metrics are strong, a business can scale aggressively while preserving optionality—choosing when and if to raise capital, rather than being forced to.
Key insight: Even modest, compounding gains in CM, ARPA, and CAC efficiency can move a company from borderline economics to best‑in‑class performance, improving both cash velocity (payback) and total customer profitability (LTV/CAC). This is the foundation of scalable, capital‑efficient SaaS growth.
Bringing It All Together
Monitoring CM and CAC Payback together gives leaders a clean view of capital efficiency: how quickly new revenue turns into cash that can be redeployed without diluting ownership or compressing runway. The operating cadence that works:
- Measure monthly by segment, plan, and channel.
- Diagnose which lever moves fastest—CM %, ARPA, churn/NRR, CAC.
- Act with targeted pricing, product, and GTM changes.
- Reinvest in the channels and segments with sub 12 month payback.
Conclusion
A SaaS business that masters Contribution Margin and CAC Payback is positioned to grow faster, with greater control over its destiny. These metrics are more than financial KPIs—they are operational guardrails that ensure each euro invested returns quickly and profitably. When CM is high and payback is short, growth becomes self-funding, valuation multiples expand, and dependency on external capital decreases. With Fincome, leaders gain real-time, granular insights into these metrics, empowering them to act with precision, inspire investor confidence, and scale on their own terms.
{{newsletter}}


Join our
Receive exclusive SaaS leader interviews and webinars every month, along with our in-depth analyses of the latest SaaS trends, with Fincome Pulse.


Discover Fincome!
Frequently Asked Questions
Expense Tracking:
Fincome is a SaaS revenue management platform designed specifically for companies with recurring revenue models (any business selling subscriptions).
Fincome automates the tracking and management of your revenues and associated KPIs (churn, LTV, CAC, etc.) in real time, without the need for a data team or manual processing, thanks to direct integrations with your billing systems and ERP.
Unlike generic BI tools, Fincome offers a turnkey, intuitive solution tailored to the specific needs of subscription-based businesses, enabling seamless collaboration across your finance, GTM, and CSM teams.
Fincome is built exclusively for companies with recurring revenue models, meaning those that track MRR or ARR, such as:
• Software publishers (SaaS)
• Media companies
• Mobile apps
• Any other B2B or B2C subscription business looking to professionalize revenue management
Fincome supports organizations at every stage of growth, from startups to mid-market and large international enterprises.
With Fincome, you gain access to a full suite of modules:
✅ Revenue: detailed ARR/MRR breakdown, cohort analysis, detection of billing errors or omissions, revenue recognition and deferred revenue (PCA)
✅ Growth: analysis of ARR movements (new business, expansion, churn, reactivation), identification of growth drivers
✅ Unit Economics: LTV, CAC, and LTV/CAC analysis by segment, channel, or geography to optimize margins
✅ Retention: deep cohort analyses, identification of key retention drivers
✅ Renewals: future MRR projections, opportunity forecasting, and churn risk reduction
✅ Forecasting: revenue growth scenario modeling to better inform strategic decisions
Fincome is the only turnkey platform built specifically for recurring revenue businesses that combines:
✅ A complete, reliable view of your recurring revenues (MRR, ARR, churn, LTV, CAC, cohorts, renewals, revenue recognition, deferred revenue)
✅ Fully customizable, automated, shareable reports powered by AI, delivering actionable insights to guide your strategic decisions
✅ Expert support to help structure and interpret your analyses, without needing to build an internal data team
✅ The ability to generate future growth scenarios, compare them side by side, and track actual vs. forecasted performance, all in real time
Unlike traditional BI tools, which require you to build and maintain your own metrics (often consuming internal resources just to produce static data visualizations), Fincome transforms your SaaS metrics into concrete, actionable recommendations — helping you move faster, with more impact and operational efficiency.
Yes! If you use an unlisted or in-house billing system, no problem — you can easily import your billing data via Excel or push it through our public API. You can access our public API documentation here.
With Fincome, you can:
✅ Reduce up to 90% of the time spent calculating and reporting your KPIs
✅ Make faster, more accurate strategic decisions
✅ Recover up to 5% of lost revenue by detecting errors or omissions
✅ Cut the risk of manual spreadsheet errors by 80%
Absolutely. Data security is at the heart of what we do. Fincome is SOC 2 Type I certified, ensuring a high level of data security and protection.
Your data is collected exclusively via read-only APIs and hosted on secure servers located in France. We never share your data with third parties without your consent.
For a detailed review of our security practices, please visit our dedicated security page.
At Fincome, customer success is a core priority. We guide you from the very start — structuring your data, training your teams, and optimizing your use of the platform to deliver value quickly.
Our team remains by your side to answer strategic or technical questions, share best practices, and help you get the most out of your analyses.
Simply request a demo on our website. We’ll walk you through the platform, assess your needs, and guide you through a smooth deployment.
Most deployments and team trainings take no more than two weeks to get fully up and running.
👉 Request a demo
Income Analytics:
Lorem ipsum dolor sit amet consectetur adipiscing elit etiam vehicula. Etiam vehicula condimentum nunc, a semper elit luctus id. Duis fringilla enim non neque aliquet.
Lorem ipsum dolor sit amet consectetur adipiscing elit etiam vehicula. Etiam vehicula condimentum nunc, a semper elit luctus id. Duis fringilla enim non neque aliquet.
Lorem ipsum dolor sit amet consectetur adipiscing elit etiam vehicula. Etiam vehicula condimentum nunc, a semper elit luctus id. Duis fringilla enim non neque aliquet.
Budget Management:
Lorem ipsum dolor sit amet consectetur adipiscing elit etiam vehicula. Etiam vehicula condimentum nunc, a semper elit luctus id. Duis fringilla enim non neque aliquet.
Lorem ipsum dolor sit amet consectetur adipiscing elit etiam vehicula. Etiam vehicula condimentum nunc, a semper elit luctus id. Duis fringilla enim non neque aliquet.
Lorem ipsum dolor sit amet consectetur adipiscing elit etiam vehicula. Etiam vehicula condimentum nunc, a semper elit luctus id. Duis fringilla enim non neque aliquet.
Wealth Management:
Lorem ipsum dolor sit amet consectetur adipiscing elit etiam vehicula. Etiam vehicula condimentum nunc, a semper elit luctus id. Duis fringilla enim non neque aliquet.
Lorem ipsum dolor sit amet consectetur adipiscing elit etiam vehicula. Etiam vehicula condimentum nunc, a semper elit luctus id. Duis fringilla enim non neque aliquet.
Lorem ipsum dolor sit amet consectetur adipiscing elit etiam vehicula. Etiam vehicula condimentum nunc, a semper elit luctus id. Duis fringilla enim non neque aliquet.