

How to master reforecasting in SaaS: Timing, process, and tools


SaaS is volatile by design. Sales velocity shifts, product-led vs. sales-led motions, expansion and contraction, and churn spikes can bend your plan out of shape within a quarter. Static annual budgets crack under that pressure. Reforecasting is how you get back to reality—fast. It’s the disciplined, repeatable reforecasting process that updates your model with actuals, resets assumptions, and keeps your SaaS financial planning aligned with what’s happening in the business. Done well, it gives founders and CFOs better board narratives, sharper cash visibility, and confident go-to-market decisions.
The importance of reforecasting in SaaS
Definition : Forecasting projects outcomes based on assumptions at a point in time. Budgeting sets targets and spending guardrails. Reforecasting updates the forecast with the latest forecast vs actuals gap analysis and re-anchors assumptions for the next 12–18 months.
Why annual budgets fail fast in SaaS ? Recurring revenue models magnify small changes. A two-point move in gross churn, a pipeline slip, or slower usage expansion can swing ARR growth, CAC payback, and runway—especially in the $5–$50M ARR range. Markets also reprice business quality quickly; operators and investors increasingly favor growth and efficiency (think Rule of 40), which pushes teams toward financial reforecasting and rolling planning instead of once-a-year budgeting.
Strategic value. Reforecasting improves capital allocation, hiring pace, and GTM investment timing. It helps you avoid over-hiring into a soft quarter, under-investing during a product-market inflection, or misjudging burn.
Reforecasting: Standard Cadences and Key Triggers
Standard cadences
- Quarterly reforecast. Best for scale-ups with moderate volatility. Aligns with board cycles and OKR resets.
- Rolling monthly forecast (12–18 months forward). Best for high-growth or usage-based SaaS. Every month you add actuals and extend the horizon, keeping decisions anchored in current data. FP&A best practices recommend 12–24 month rolling horizons integrated with operational drivers.
Quick comparison
Event-based triggers
Reforecast immediately when any of these happen:
- Churn spike or retention risk. If gross churn/NRR moves outside guardrails (e.g., SMB churn rises into double digits or NRR dips toward 100%), reset top-line. NRR and churn are the fastest way to sanity-check expansion assumptions. Industry and operator surveys reinforce how sensitive valuations are to net retention and efficiency. (Bessemer Venture Partners)
- Expansion slowdown. If sales-assist upsell cycles lengthen or product-led expansion slackens, temper expansion MRR multipliers and seat-growth factors. Bessemer’s Cloud 100 benchmarks highlight how leaders re-weight growth vs. efficiency as conditions change. (Bessemer Venture Partners)
- Cash runway changes. A fundraising slip, debt covenant, or burn acceleration shortens runway and forces a mix shift (e.g., slower hiring, higher gross margin focus).
- Budget variance signals. If your forecast vs actuals show material gaps in CAC, OPEX, or gross margin, reforecast before small misses compound.
Investor & board preparation
Ahead of board or fundraising discussions, reforecast to tighten your story: “Here’s what changed, why, and what we’re doing about it.” High-quality operators use rolling, driver-based models to show credible paths to growth and efficiency.
{{discover}}
Reforecasting in 5 Steps: A Cross-Functional Sprint
Treat reforecasting as a 5-step, cross-functional sprint you can complete in days—not weeks. The outcome: a single source of truth for the next 12–18 months.
Step 1 — Compare Forecast vs Actuals
Run a variance analysis by stream and driver:
- Top-line: New ARR, expansion ARR, churn/contraction.
- Unit economics: CAC, CAC payback, gross margin, net dollar retention.
- Cash: Burn, runway, working capital effects (e.g., collections).
- Revenue timing: Deferred revenue movement, ASC-606 recognition schedules.
Formula : Variance % = (Actual − Plan) ÷ Plan.
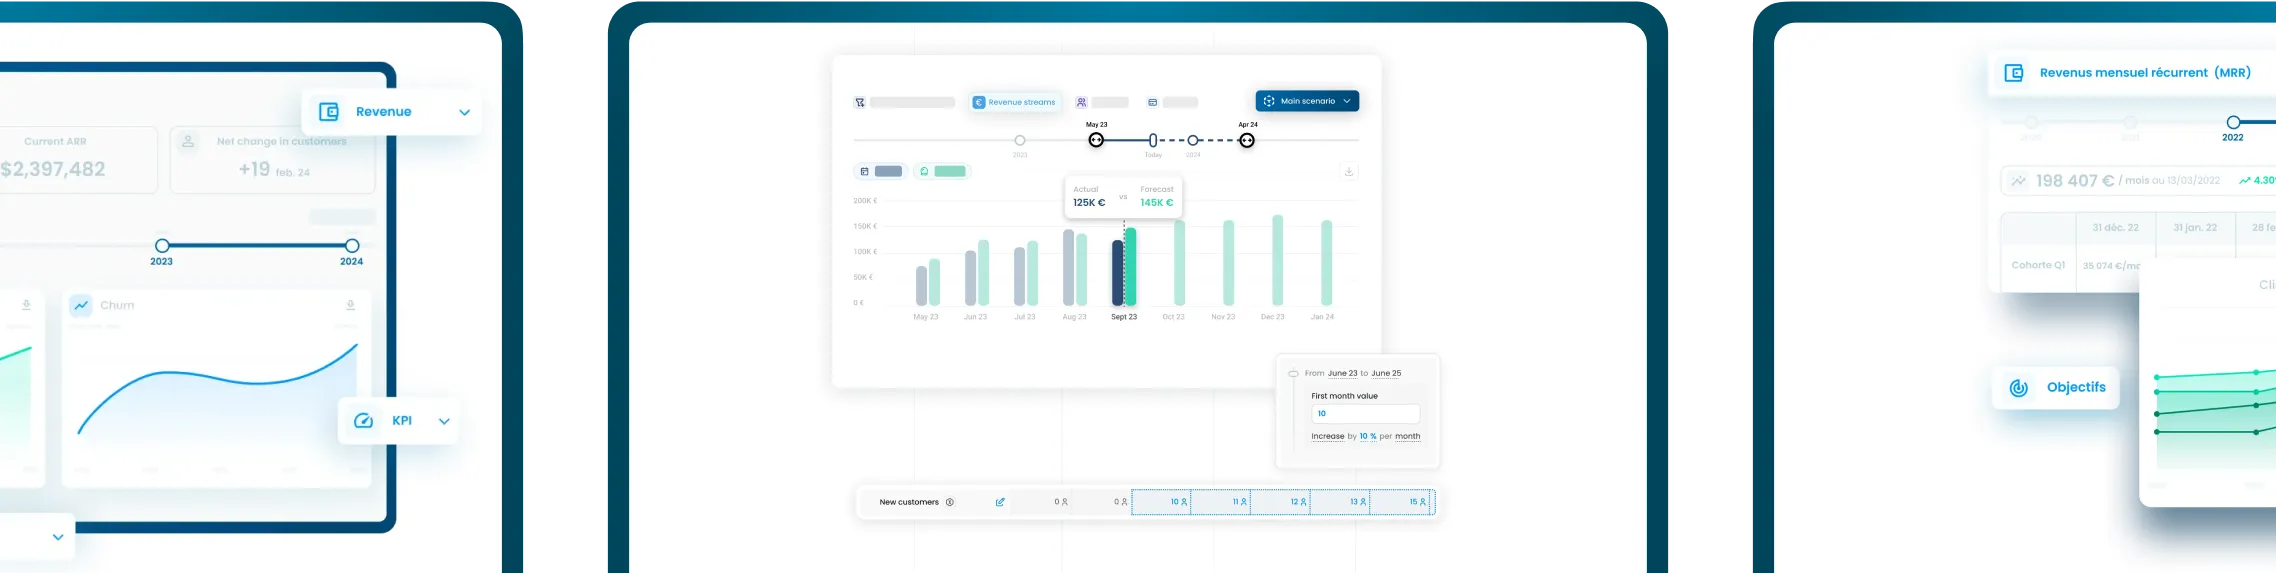
Example : In this quarter, the company had planned to generate $600k in new ARR but achieved only $480k, resulting in a negative variance of 20%. Gross churn was forecasted at 1.5% per month, yet the actual figure rose to 2.2%, which is an increase of 0.7 percentage points and indicates a negative trend. The CAC payback period, initially expected to be 12 months, extended to 15 months, showing a slower recovery of customer acquisition costs. Finally, the burn rate overshot its $1.0M target, reaching $1.25M, which means the company spent 25% more than planned. If revenue recognition is out of sync with billings (annual upfront), deferred revenue and ASC-606 scheduling should also be reviewed to avoid misstating MRR and margin. Overall, this example highlights how quickly small deviations in churn, acquisition costs, or expense control can significantly impact the company’s financial health and decision-making.

Step 2 — Identify the root cause of variances
Pattern the miss rather than averaging it away.
- Sales mix shift. Enterprise deals slipped (timing) vs. SMB volume shortfall (demand).
- Retention quality. Onboarding gaps on a new segment drove early churn; usage-based fatigue reduced expansion.
- Efficiency drift. CAC rose because paid channels saturated; SDR ramp slower than planned; demo-to-close dropped.
Diagnostic cheatsheet
Step 3 — Reset top-line assumptions
Update the drivers that actually produce MRR/ARR in your model.
- New ARR. Reweight pipeline coverage (e.g., 2.5× for enterprise, 1.5× for mid-market), adjust win rates and sales cycle lengths.
- Expansion ARR. Revise adoption/seat-growth curves, usage multipliers, and attach rates for add-ons.
- Churn & contraction. If gross churn increased from 1.5% to 2.2% monthly, reflect it immediately; don’t “average it out.”
- Pricing/packaging. If discounts rose 5pp, lower realized ASP.
Mini-model illustration (monthly)
Industry operator data show how quickly quotas, win rates, and budgets re-balance under efficiency pressure—use that context to sanity-check your reset.
Step 4 — Recast expense scenarios and runway
Tie spending to revised growth and efficiency:
- GTM. Shift budget to efficient channels, reduce underperforming segments, retime AE/SDR hires to pipeline reality.
- Product & infra. Prioritize features that drive retention and expansion; tackle margin levers (e.g., architecture cost, support levels).
- G&A. Freeze nice-to-have spend; keep audit, security, and revenue ops funded.
Step 5 — Align finance, GTM, and product on one plan
A reforecast is only as good as the operating rhythm behind it.
- Single source of truth. Centralize billing and revenue data, automate real-time SaaS reporting, and reconcile MRR/ARR, churn, cohorts, and recognition.
- Driver owners. Sales owns pipeline and conversion drivers; Product owns adoption/usage; Finance owns revenue timing and cost levers.
- Operating rituals. Monthly rolling forecast review; quarterly board prep; weekly KPI stand-up for leading indicators.
Want a tracking blueprint for the product and GTM data behind your model?
SaaS data tracking plan
Common Reforecasting Pitfalls—and How to Avoid Them
1) Overreliance on Excel and manual models
The issue. Spreadsheets break under multi-product, multi-currency, and usage-based complexity; version control slows decisions; errors hide in tabs.
Fix. Adopt SaaS forecasting tools that integrate billing (Stripe, Chargebee), accounting (QuickBooks, Pennylane), and CRM. FP&A standards for rolling forecasts emphasize tight data integration and technology to free time for analysis.
2) Ignoring deferred revenue and contract changes
The issue. Annual upfront contracts and mid-term upgrades/downgrades break simple revenue schedules. Mis-timing recognition distorts gross margin, burn, and ARR quality.
Fix. Align to ASC-606/IFRS-15: identify performance obligations, allocate via SSP, and update schedules on modifications. Reference primary guidance and recent clarifications.
3) Finance-only reforecasting
The issue. Finance updates the file; GTM and Product keep operating on the old plan. Execution diverges from the new model.
Fix. Make driver owners visible (pipeline, adoption, discounting, hiring pace). Publish a one-pager: “What changed; what we’ll do next; how we’ll measure it.”
4) Waiting too long to reforecast
The issue. Teams hope to “make it up next month,” and misses compound.
Fix. Set automatic triggers: if CAC payback > 14 months, NRR < 105%, or burn > plan by 15%, run a mini-reforecast this week. Embed a monthly rolling cadence to prevent drift. Leading practitioners and surveys highlight how high-performing cloud companies operate with rolling, driver-based plans and real-time dashboards. (Bessemer Venture Partners)
How to Implement a Reforecasting Process
Use this practical blueprint to launch or upgrade your cadence in two cycles:
Week 1: Stand-up
- Annalise data. Billing, accounting, CRM, and product analytics feed a unified metric layer (MRR, churn, cohorts, CAC, payback).
- Define guardrails. NRR, CAC payback, gross margin, burn, runway thresholds.
- Map drivers. For each key KPI, list inputs, owner, and update frequency.
Week 2: First reforecast sprint
- Variance pack. Auto-produce forecast vs actuals with commentary by driver.
- Driver reset. Sales: win rates, cycle time, ASP; Product: adoption/usage; Finance: recognition, COGS, opex plans.
- Scenario set. Base / Upside / Downside with explicit assumptions.
- Ops alignment. Publish the new plan, KPIs, and review cadence.
Driver/KPI quick reference
Conclusion
Financial reforecasting is how SaaS leaders move from reactive firefighting to proactive control. Quarterly or rolling monthly, the discipline is the same: compare forecast vs actuals, find the true drivers, reset assumptions, and re-align the operating plan. That cadence tightens board narratives, protects runway, and improves capital allocation. It also strengthens internal trust: sales knows what to hit; product knows what to build; finance knows how to fund it.
If your current process still depends on brittle spreadsheets or delayed data, now is the moment to replace Excel for SaaS forecasting with a unified system. Adopt a rolling reforecasting process, wire it to live billing and CRM data, and hold a monthly driver review. You will make faster, better decisions—and you’ll be ready for whatever your next quarter throws at you.
{{newsletter}}


Join our
Receive exclusive SaaS leader interviews and webinars every month, along with our in-depth analyses of the latest SaaS trends, with Fincome Pulse.


Discover Fincome!
Frequently Asked Questions
Expense Tracking:
Fincome is a SaaS revenue management platform designed specifically for companies with recurring revenue models (any business selling subscriptions).
Fincome automates the tracking and management of your revenues and associated KPIs (churn, LTV, CAC, etc.) in real time, without the need for a data team or manual processing, thanks to direct integrations with your billing systems and ERP.
Unlike generic BI tools, Fincome offers a turnkey, intuitive solution tailored to the specific needs of subscription-based businesses, enabling seamless collaboration across your finance, GTM, and CSM teams.
Fincome is built exclusively for companies with recurring revenue models, meaning those that track MRR or ARR, such as:
• Software publishers (SaaS)
• Media companies
• Mobile apps
• Any other B2B or B2C subscription business looking to professionalize revenue management
Fincome supports organizations at every stage of growth, from startups to mid-market and large international enterprises.
With Fincome, you gain access to a full suite of modules:
✅ Revenue: detailed ARR/MRR breakdown, cohort analysis, detection of billing errors or omissions, revenue recognition and deferred revenue (PCA)
✅ Growth: analysis of ARR movements (new business, expansion, churn, reactivation), identification of growth drivers
✅ Unit Economics: LTV, CAC, and LTV/CAC analysis by segment, channel, or geography to optimize margins
✅ Retention: deep cohort analyses, identification of key retention drivers
✅ Renewals: future MRR projections, opportunity forecasting, and churn risk reduction
✅ Forecasting: revenue growth scenario modeling to better inform strategic decisions
Fincome is the only turnkey platform built specifically for recurring revenue businesses that combines:
✅ A complete, reliable view of your recurring revenues (MRR, ARR, churn, LTV, CAC, cohorts, renewals, revenue recognition, deferred revenue)
✅ Fully customizable, automated, shareable reports powered by AI, delivering actionable insights to guide your strategic decisions
✅ Expert support to help structure and interpret your analyses, without needing to build an internal data team
✅ The ability to generate future growth scenarios, compare them side by side, and track actual vs. forecasted performance, all in real time
Unlike traditional BI tools, which require you to build and maintain your own metrics (often consuming internal resources just to produce static data visualizations), Fincome transforms your SaaS metrics into concrete, actionable recommendations — helping you move faster, with more impact and operational efficiency.
Yes! If you use an unlisted or in-house billing system, no problem — you can easily import your billing data via Excel or push it through our public API. You can access our public API documentation here.
With Fincome, you can:
✅ Reduce up to 90% of the time spent calculating and reporting your KPIs
✅ Make faster, more accurate strategic decisions
✅ Recover up to 5% of lost revenue by detecting errors or omissions
✅ Cut the risk of manual spreadsheet errors by 80%
Absolutely. Data security is at the heart of what we do. Fincome is SOC 2 Type I certified, ensuring a high level of data security and protection.
Your data is collected exclusively via read-only APIs and hosted on secure servers located in France. We never share your data with third parties without your consent.
For a detailed review of our security practices, please visit our dedicated security page.
At Fincome, customer success is a core priority. We guide you from the very start — structuring your data, training your teams, and optimizing your use of the platform to deliver value quickly.
Our team remains by your side to answer strategic or technical questions, share best practices, and help you get the most out of your analyses.
Simply request a demo on our website. We’ll walk you through the platform, assess your needs, and guide you through a smooth deployment.
Most deployments and team trainings take no more than two weeks to get fully up and running.
👉 Request a demo
Income Analytics:
Lorem ipsum dolor sit amet consectetur adipiscing elit etiam vehicula. Etiam vehicula condimentum nunc, a semper elit luctus id. Duis fringilla enim non neque aliquet.
Lorem ipsum dolor sit amet consectetur adipiscing elit etiam vehicula. Etiam vehicula condimentum nunc, a semper elit luctus id. Duis fringilla enim non neque aliquet.
Lorem ipsum dolor sit amet consectetur adipiscing elit etiam vehicula. Etiam vehicula condimentum nunc, a semper elit luctus id. Duis fringilla enim non neque aliquet.
Budget Management:
Lorem ipsum dolor sit amet consectetur adipiscing elit etiam vehicula. Etiam vehicula condimentum nunc, a semper elit luctus id. Duis fringilla enim non neque aliquet.
Lorem ipsum dolor sit amet consectetur adipiscing elit etiam vehicula. Etiam vehicula condimentum nunc, a semper elit luctus id. Duis fringilla enim non neque aliquet.
Lorem ipsum dolor sit amet consectetur adipiscing elit etiam vehicula. Etiam vehicula condimentum nunc, a semper elit luctus id. Duis fringilla enim non neque aliquet.
Wealth Management:
Lorem ipsum dolor sit amet consectetur adipiscing elit etiam vehicula. Etiam vehicula condimentum nunc, a semper elit luctus id. Duis fringilla enim non neque aliquet.
Lorem ipsum dolor sit amet consectetur adipiscing elit etiam vehicula. Etiam vehicula condimentum nunc, a semper elit luctus id. Duis fringilla enim non neque aliquet.
Lorem ipsum dolor sit amet consectetur adipiscing elit etiam vehicula. Etiam vehicula condimentum nunc, a semper elit luctus id. Duis fringilla enim non neque aliquet.